One-click access to nearly 250 makers through the Online Artists Directory! Explore Now ×
Advertisement

Seeing Is Believing

Seeing Is Believing

Three craft artists turn scientific data into visual works that help explain the world.

Seeing Is Believing

Three craft artists turn scientific data into visual works that help explain the world.
Fall 2023 issue of American Craft magazine
Author Paola Singer
Made from kiln-cast glass, Viviano’s Recasting Detroit, 2021, combines imagery from the city’s manufacturing past and its current urban landscape, 11 x 16.5 x 13.5 in. Photo by Tim Thayer /  RM Hensleigh.

Made from kiln-cast glass, Viviano’s Recasting Detroit, 2021, combines imagery from the city’s manufacturing past and its current urban landscape, 11 x 16.5 x 13.5 in. Photo by Tim Thayer /  RM Hensleigh.

Norwood Viviano’s Detroit Population Shift, 2009, CNC machined and cast aluminum, 36 x 26 x 18 in. The piece, which depicts Detroit’s changing population over time, took hundreds of hours to carve and required a computerized mill. Photo by Tim Thayer.

After moving to Plainwell, Michigan, a town of about 4,000 residents on the banks of the Kalamazoo River, artist Norwood Viviano realized that nearly everyone he met had in some way been affected by the paper mill industry. The Plainwell Paper Mill, established in 1887, was the town’s beating heart until it declared bankruptcy and shuttered its plant two decades ago.

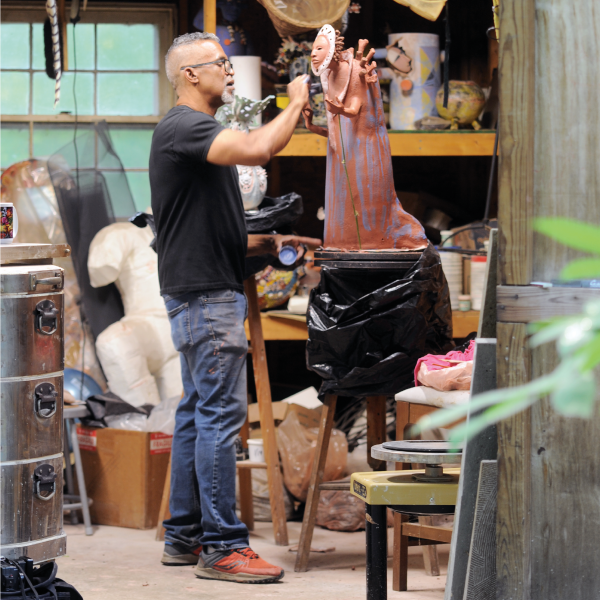
Viviano chose Plainwell in 2005 to be close to Grand Valley State University, where he teaches sculpture, and because it seemed like a tranquil and affordable place to raise a family. Being there, he says, made him think more deeply about the “ties between industry and community and the hierarchies at play,” leading him to create a series of metal sculptures called Recasting Michigan. The sculptures showed, in a tactile way, the population shifts that have taken place since the industrial revolution in manufacturing cities across the state. “That was my first foray into experimenting with data,” he says of the works, completed between 2009 and 2011. “Most people would walk right by raw statistics, but if you make it three-dimensional, it has an ability to draw you in.”

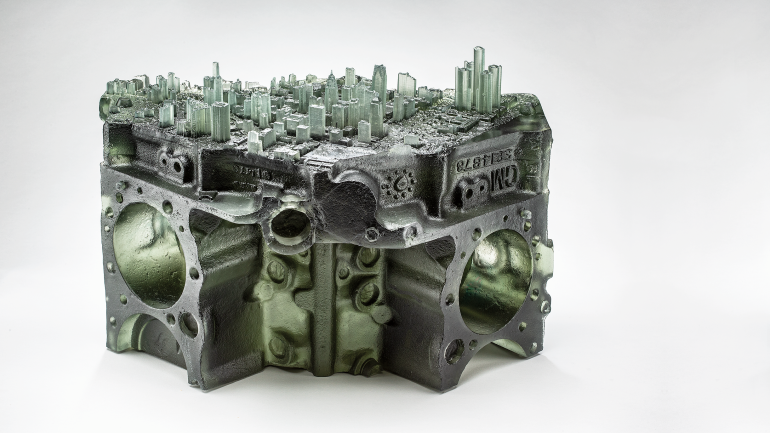
One of the sculptures, made of cast and machined aluminum, has an angular, geode-shaped base representing Detroit’s population growth and decline over time (it peaked in 1950), and a flat top showing a detailed three-dimensional portrait of the city as seen from the air. Carving it required a computerized mill and took 300 hours.

Viviano is part of a group of sculptors and craft artists who are using statistics and data in their creative processes. The themes they deal with are varied, yet they seem unified in their goal: to help people understand important social, political, and environmental changes that occur over long periods of time.

“Craft is really effective at providing accessible pathways to understanding the world around us,” says Beth C. McLaughlin, artistic director and chief curator at the Fuller Craft Museum in Massachusetts, which recently unveiled an exhibit called Material Mapping: Data-driven Sculpture by Adrien Segal & Norwood Viviano, on view until March 2024. “Humans have been using their hands to convey information for thousands of years, and incorporating data is a way of expanding this tradition.”

McLaughlin says she is seeing more and more craft related to data, as well as significant interest from collectors. Although the trend is hard to quantify, there is anecdotal evidence supporting a growing link between facts and statistics and craft, including the publication this year of Making with Data: Physical Design and Craft in a Data-Driven World (CRC Press), which presents more than two dozen contemporary designers, researchers, and artists who are using data to produce objects, spaces, and experiences.

Illustrating Natural Phenomena
Adrien Segal, the other artist in the Fuller exhibit, has used a variety of materials, including bronze and plywood, to create sculptures that illustrate environmental processes and natural phenomena. In 2017 she won a CODA award for California Water Rights, a monumental site-specific installation based on water allocation data in California. The three-story piece, which occupies the atrium of a tech lab, is made of more than 1,000 color-coded ball chains draped at varying lengths from an undulating metal “river” that hangs from the ceiling. Each strand corresponds to the amount of water allocated to an entity, be it a corporation, government institution, or individual, and each ball represents one acre-foot of water, or about 326,000 gallons, providing a striking visual of the immense quantities of water used in the state.

Although the piece raises questions about sustainability and shows the perils of mismanaging a finite natural resource, Segal says she is more interested in presenting information in an experiential way than in feeding us an opinion.

“Some people think I’m an environmental artist, but that’s not a true reflection of who I am,” says the Oakland, California, resident. “I find inspiration in tapping into natural patterns and processes and connecting to these grander forces in the universe. I provide the richest possible information about how I got to those things, but leave the interpretation to others.”

Pressed further, she adds: “I don’t believe the purpose of art is to have an agenda.” In this sense, she’s somewhat of an outlier among the cohort of artists who use data.

The strands in California Water Rights, 2017, Adrien Segal’s aluminum and ball chain suspended sculpture, represent the largest permitted water users in California, 34 x 16 x 32 ft.

The strands in California Water Rights, 2017, Adrien Segal’s aluminum and ball chain suspended sculpture, represent the largest permitted water users in California, 34 x 16 x 32 ft. Photo by Mario Gallucci, with art consultant Heidi McBride & Co.

Tali Weinberg’s Silt Study: Arkansas White River Basin, Silt Study: Texas Gulf Coast River Basin, and Silt Study: Lower Mississippi River Basin, 2021, plant fibers and dyes, petrochemical-derived fishing line, 18 x 18 in. each.

Tali Weinberg’s Silt Study: Arkansas White River Basin, Silt Study: Texas Gulf Coast River Basin, and Silt Study: Lower Mississippi River Basin, 2021, plant fibers and dyes, petrochemical-derived fishing line, 18 x 18 in. each. Photo by Joseph Minek.

Weinberg in her studio. Photo by Melissa Luckenbaugh.

Weinberg in her studio. Photo by Melissa Luckenbaugh.

Detail of Silt Study: Souris Red Rainy Basin, 2021. Photo by Joseph Minek.

Detail of Silt Study: Souris Red Rainy Basin, 2021. Photo by Joseph Minek.

Depicting the Climate Crisis
“I’ve been making work with climate data as a response to the climate crisis for over eight years,” says Illinois-based weaver and sculptor Tali Weinberg. “Before that, I made work about gender violence and other forms of injustice.”

Her recent climate-related series, 2021’s Silt Studies, focuses on the minute particles of rocks and minerals that are carried away by flowing water, eventually becoming sediments somewhere else. As Weinberg explains on her website, “When ecosystems are polluted, silt goes from benign to destructive.”

There are 18 Silt Studies, each a unique tapestry made of hand-dyed, earth-toned cotton lines representing temperature data for some of the major watersheds in the US, including the South Atlantic Gulf Basin and the Lower Colorado River Basin. “In my translation of the data, 126 years takes form as 18 rows of color, each row an average of seven years of temperature,” explains the artist, who interweaves plant-derived fibers with petrochemical-derived fishing lines, drawing a connection between petrochemical extraction and the buildup of toxic plastics in the earth and in human bodies.

She uses a floor loom, generating the color-coded information line of thread by line of thread. “I don’t think of weaving in binary terms, but it does lend itself to this translation process,” she says of the craft, which has historically been linked to mathematics, particularly geometry.

Weinberg’s tapestries are undeniably beautiful, the kind that could find a place of prominence on the walls of an elegant home. When asked about the possibility that their attractiveness might distract people from the message (i.e., the gravity of the world’s environmental ills), she says that “art for centuries has used beauty as a way of engaging people.” But she also clarifies that, in addressing the climate crisis and the losses that come with it, it is worth remembering that “there is still a lot to care for and protect, and a lot that’s still beautiful.”
 

The Beauty Draws You In
One of Norwood Viviano’s latest projects, Cities Underwater, is also one of his most visually striking. It consists of nested cylinders made of ethereal glass. Translucent blue outer vessels represent water, and grayish inner vessels represent cities. These interior vessels are thick at the bottom, depicting our present time, and become impossibly thin at the top, our future. Using lidar data (a remote sensing method used to examine the surface of the Earth) along with scientific projections, Viviano shows us the projected loss of land due to rising seas in a stark way that is easy to grasp. By the year 2500, for example, New Orleans could be completely underwater; New York City could be 39 percent underwater.

“Beauty is a strategy to draw someone into a conversation before they know what the work is about,” he says. “It may make people more willing to engage with the content.”

Viviano started working with glass after completing a fellowship at the New Jersey–based Wheaton Arts and Cultural Center, an internationally acclaimed program devoted to glass. Before that, he worked with ceramics, resin, and bronze. Having access to university labs and workshops allows artists to experiment with materiality and process, and thus bring data to life in awe-inspiring ways.

Installation detail of Viviano’s blown glass Cities Underwater, 2018, showing predicted land loss due to sea level rise in Boston; Galveston, Texas; and Miami Beach and Miami, Florida.
Installation detail of Viviano’s blown glass Cities Underwater, 2018, showing predicted land loss due to sea level rise in Boston; Galveston, Texas; and Miami Beach and Miami, Florida. Photo by Cathy Carver.

Segal, for example, has her own studio in Alameda but sometimes uses the facilities at the California College of the Arts, where she holds a teaching position. And one of her most important pieces, called Molalla River Meander, was completed during a residency at the Oregon College of Arts and Craft. This wooden sculpture depicts the subtle changes in alluvial flows that happened over 15 years in a section of the Molalla River in Oregon. It has 15 layers of plywood that were cut with a CNC router (a machine that uses computer programming to control a high-speed cutter), then carefully glued together and sanded, resulting in a cohesive flowing form. “I wanted people to connect to how a river moves in a more intuitive way,” explains the artist.

Many of us think of data as being austere and unapproachable, but artists like Viviano, Segal, and Weinberg make us realize that’s not necessarily true. Not as long as we have the benefit of their artistic vision.

“We are trying to tell stories with data,” says Viviano, “of challenges related to the past, present, and future—and we’re telling them from a point of view.”

norwoodviviano.com | @norwoodviviano
adriensegal.com | @adriensegal
taliweinberg.com | @tali.weinberg
fullercraft.org | @fullercraft

Adrien Segal’s carved plywood Molalla River Meander, 2013, shows changes in alluvial flows in the Oregon river over 15 years, 15 x 46 x 11 in. Photo by Adrien Segal.

Adrien Segal’s carved plywood Molalla River Meander, 2013, shows changes in alluvial flows in the Oregon river over 15 years, 15 x 46 x 11 in. Photo by Adrien Segal.

Viviano (second from right), Julian Goza, Benjamin Cobb, Sayuri Fukuda, Pablo Soto, Niko Dimitrijevic, Gabe Feenan, and Sarah Gilbert create a population graph of New York City during Viviano’s 2017 residency at the Museum of Glass in Tacoma, Washington.

Viviano (second from right), Julian Goza, Benjamin Cobb, Sayuri Fukuda, Pablo Soto, Niko Dimitrijevic, Gabe Feenan, and Sarah Gilbert create a population graph of New York City during Viviano’s 2017 residency at the Museum of Glass in Tacoma, Washington. Photo by Walter Lieberman.

Segal grinding away on Molalla River Meander. Photo courtesy of the artist.

Segal grinding away on Molalla River Meander. Photo courtesy of the artist.

Advertisement